Here is the bootstrapping code to calculate confidence intervals for the variance components, as done in Messier et al. 2010. Ecology Letters (DOI: 10.1111/j.1461-0248.2010.01476). I have received numerous requests to share, so have decided to make it available publicly.
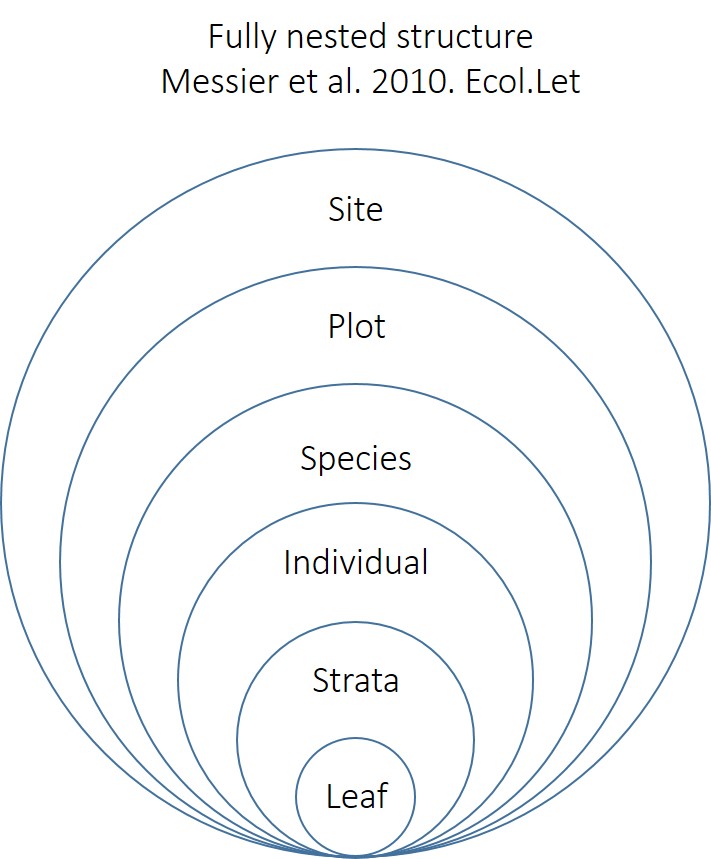
This code assumes this fully nested structure:
*** Note that***:
– The nesting structure of the model fits the sampling design of this study. Different studies using different sampling designs will have to adjust the structure of the model accordingly.
– This code is provided is as a courtesy. It was written in 2009, with the versions of the R packages available at the time. I cannot guarantee that it will still work as the packages are updated.
============================================
d<-read.csv(‘C:/Documents and Settings/U/Desktop/MSc/Data/Mydata/lft.csv’,h=T,na.strings=”NA”)
#Adjust path as necessary
library(ape)
library(nlme)
# VARCOMP
varcomp(lme(log(LMA)~1,random=~1|Site/Plot/Species/Tree/Strata,data=d,na.action=na.omit),1) # This is a fully nested model. Used in Messier et al. 2010. Ecology Letters.
# CONFIDENCE INTERVALS
# LMA –
Site<-rep(NA,500) ## create empty vectors in which to store data
Plot<-rep(NA,500)
Species<-rep(NA,500)
Tree<-rep(NA,500)
Strata<-rep(NA,500)
Leaf<-rep(NA,500)
for (i in 1:500){ ## Do 500 bootstrap runs
d1<-d[sample(1:1952,1952,replace=T),] ## Randomize dataset
try(varcomp.LMA<-varcomp(lme(log(LMA)~1,random=~1|Site/Plot/Species/Tree/Strata,data=d1,na.action=na.omit),1),silent=T)
## store output of each bootstrap runs in these vectors
if (is.numeric(varcomp.LMA)){
Site[i]<-varcomp.LMA[1]
Plot[i]<-varcomp.LMA[2]
Species[i]<-varcomp.LMA[3]
Tree[i]<-varcomp.LMA[4]
Strata[i]<-varcomp.LMA[5]
Leaf[i]<-varcomp.LMA[6]
}
}
## use ‘try’ and ‘if (is.numeric)’ because the bootstrap runs that fail produce an error
## message, which cannot be stored in the vectors. These bits of code avoid the whole
## analysis aborting if one of the runs fails.
(CI.Site<-quantile(Site,c(0.025,0.975),na.rm=T))
(CI.Plot<-quantile(Plot,c(0.025,0.975),na.rm=T))
(CI.Species<-quantile(Species,c(0.025,0.975),na.rm=T))
(CI.Tree<-quantile(Tree,c(0.025,0.975),na.rm=T))
(CI.Strata<-quantile(Strata,c(0.025,0.975),na.rm=T))
(CI.Leaf<-quantile(Leaf,c(0.025,0.975),na.rm=T))
### Use na.rm=T because the bootstrap runs that fail will print NAs in the vector, which ### will affect the calculation of the quantiles.
====================================================
Below is the code used in Messier et al. 2017 Ecography. It is slightly different from the nesting structure above, but gives qualitatively similar results. Here, first leaf is nested within strata, strata is nested within tree and tree is nested within species. Then in a second hierarchy, plot is nested within site. Then, the two hierarchies are crossed, such that the same species can be found in different sites:
This code assumes this hierarchical structure: 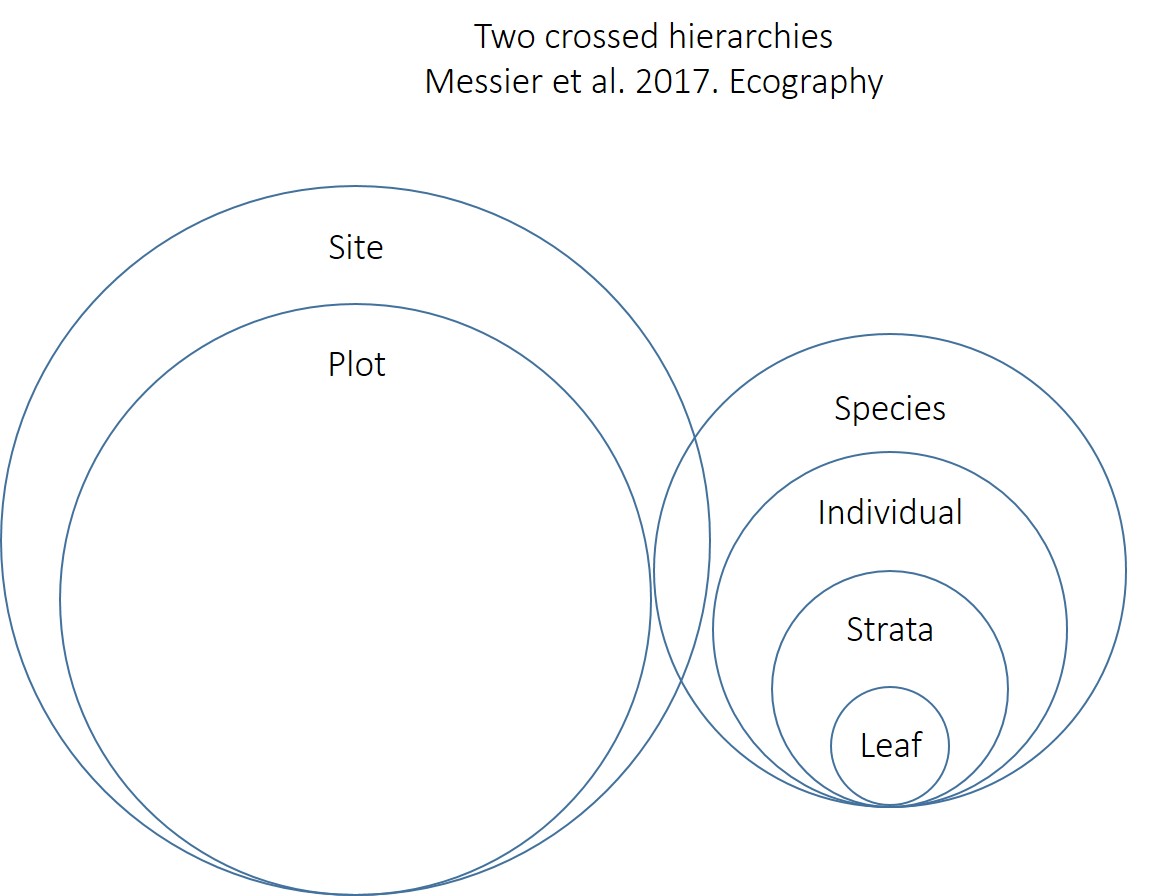
Variance component analyses
e.g. with LMA
m.LMA<-lmer(log(LMA)~1+(1|Species/Tree/Strata)+(1|Site/Plot), data=d, na.action=na.omit)
variances.LMA<-c(unlist(lapply(VarCorr(m.LMA),diag)), attr(VarCorr(m.LMA),”sc”)^2) #get variances
# this is the same as: print(VarCorr(m.LMA),comp=”Variance”)
# raw variance
variances.LMA
# % Variance
(var.comp.LMA<-variances.LMA/sum(variances.LMA))